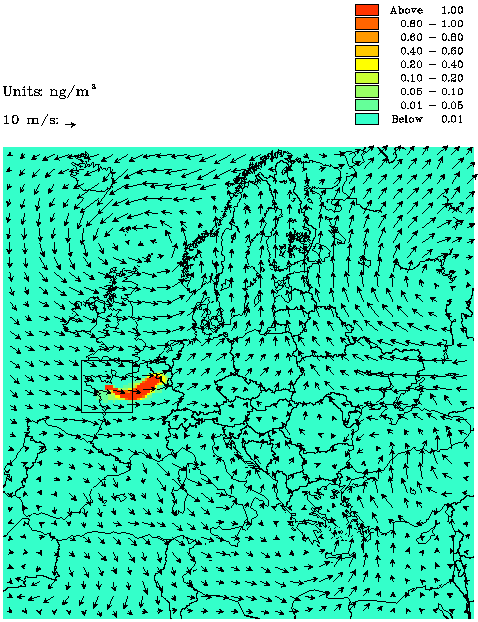

Figure 2a: Model simulations of the development of the surface concentrations (Perflouro-Methyl-Cyclo-Hexane, PMCH) released from Britanny, France, during the first release of the European Tracer EXperiment (ETEX-1).The figure show the DREAM model results of the situation 12 hours after start of the release. The square indicates the area where the Lagrangian model is operating. The Eulerian model is operating in the whole model domain. Click here to see the animation (NB: 1.8 Mb)

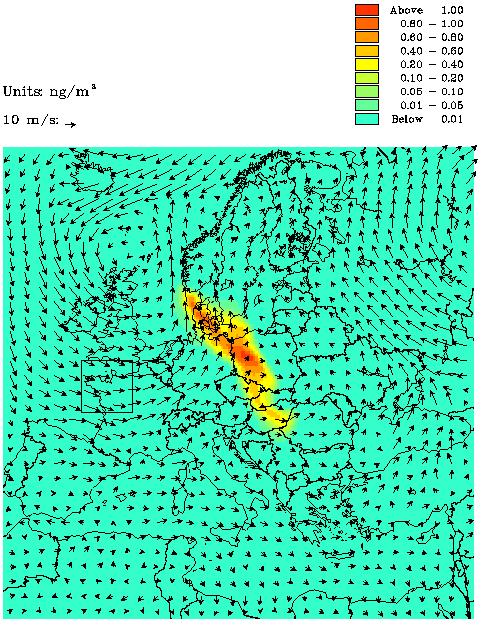
Figure 2b: Same as figure 2a, but 48 hours after start of the release.

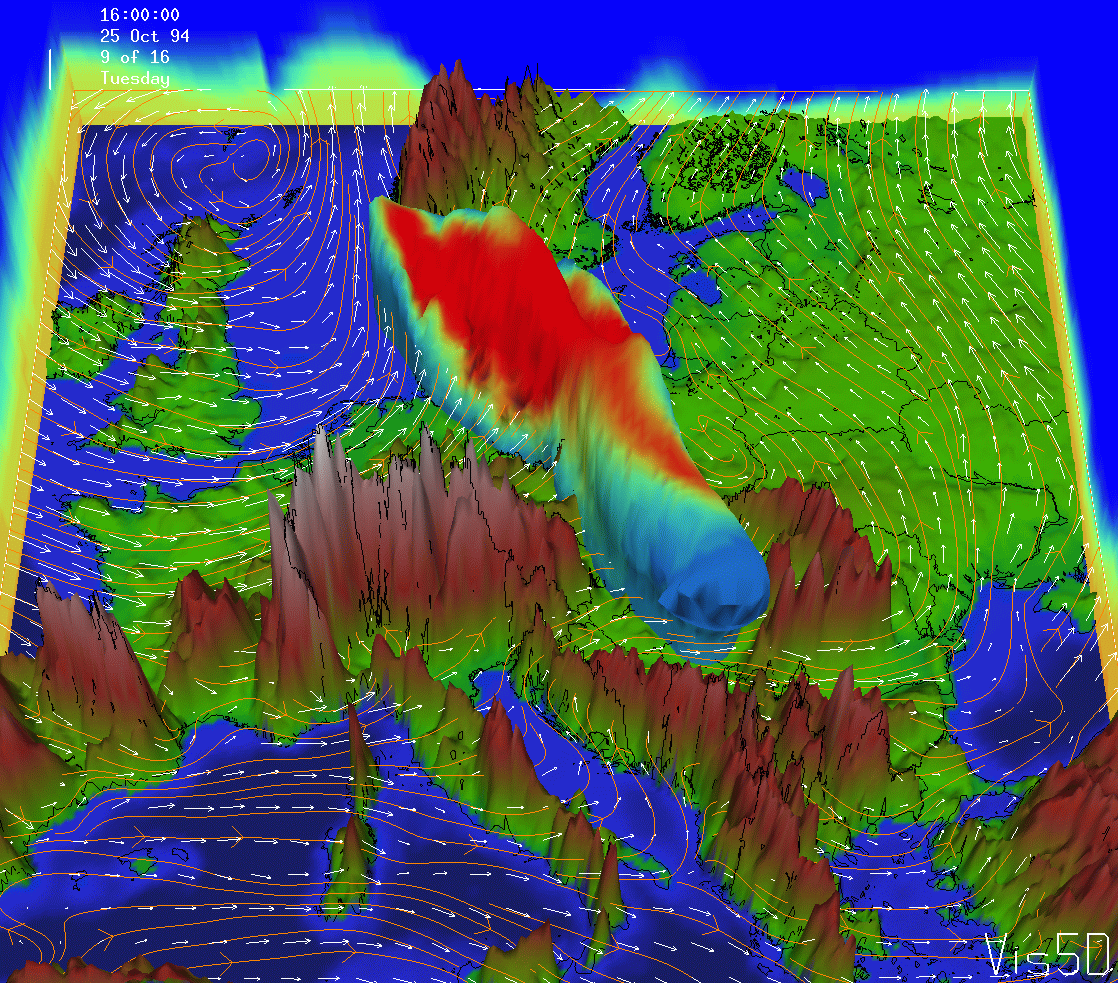
Figure 3: A three-dimensional illustration of figure 2b showing the isosurface (constant concentrations of 0.05 ng/m3). The plot shows the DREAM model results at 48 hours after start of release, where the concentrations cover large parts of Europe. The surface concentrations (see figure 2) are plotted on the isosurface. Click here to see the animation (NB: 8 Mb)