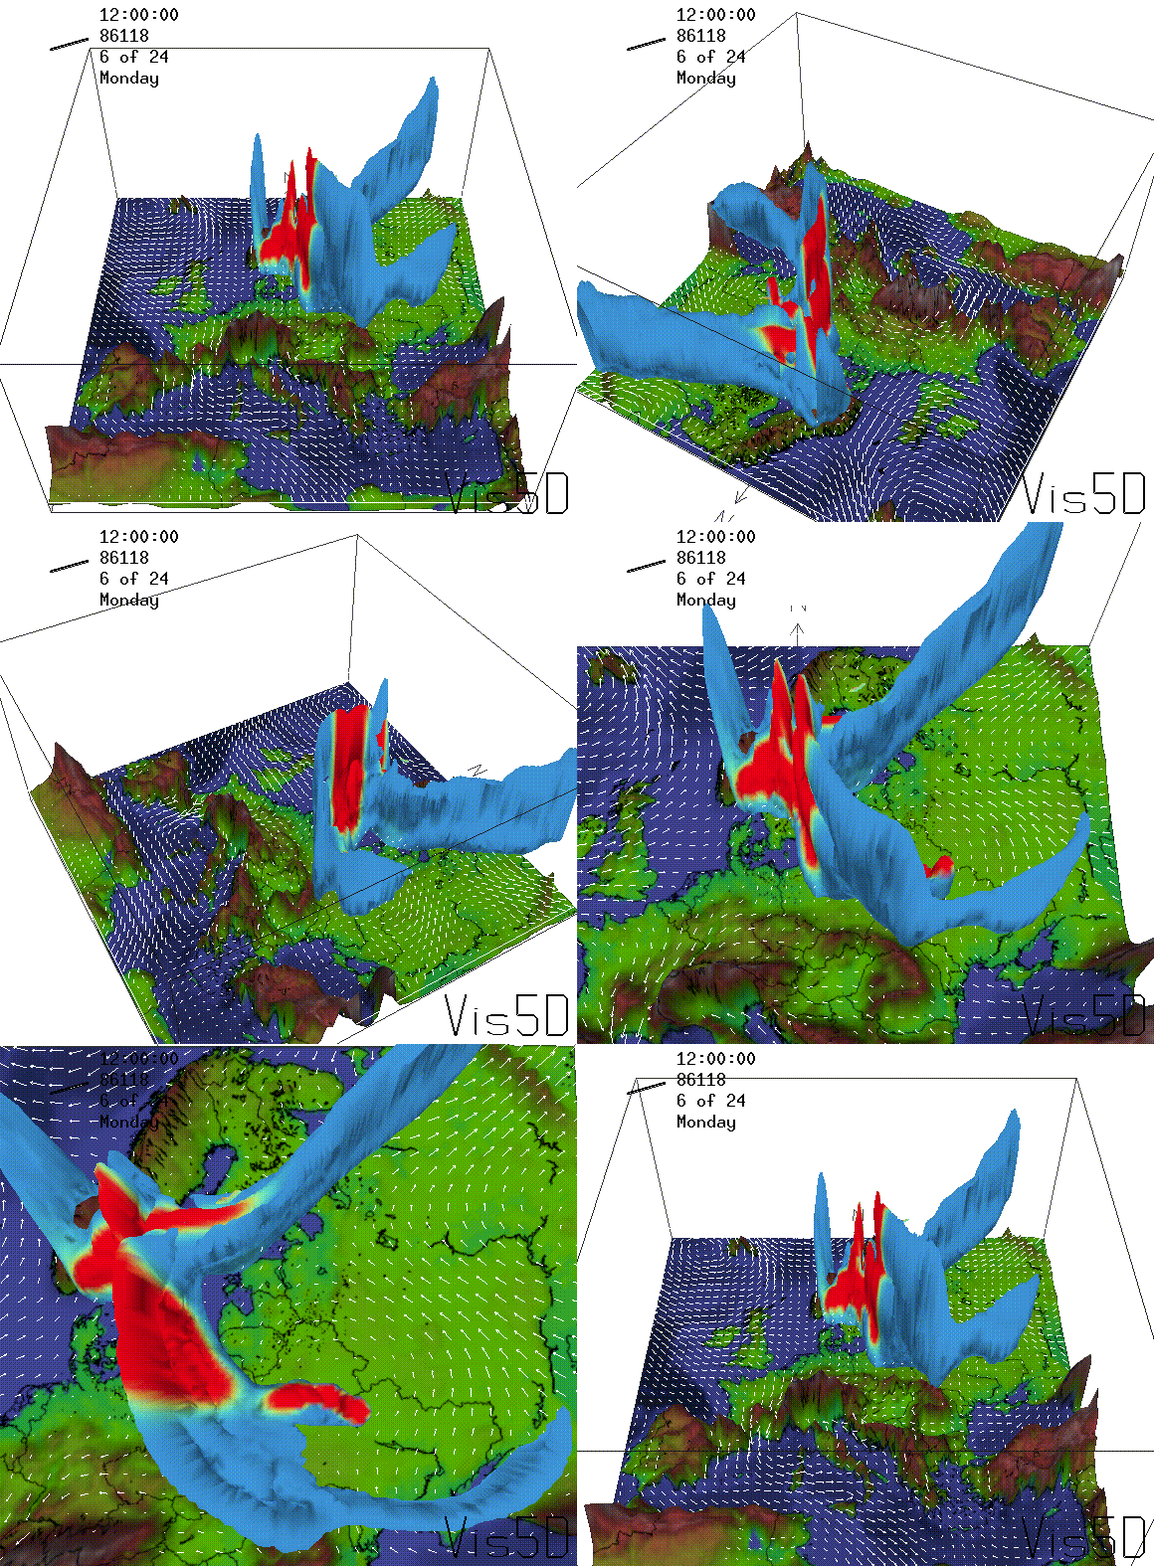

Figure 6: A three-dimensional animated illustration of the 137Cs concentrations from the Chernobyl accident, 3 days after start of the accident. The figure shows an isosurface (constant concentrations of 0.05 Bq/m3), calculated by using the DREAM model. The initial transport from the accident site was towards the north-west near the ground. However, at higher altitudes, the transport was in the opposite direction (towards south-east). The surface concentrations are plotted on the isosurface (red colors indicate areas where the plume is in contact with the ground).